


As a tester, chances are you work with a web app (mobile apps have gained a lot of ground lately, too). To make testing more efficient, it’s good practice to use what you have in your toolkit, and one of the most readily available (and free!) tools for testers are the Developer Tools (or DevTools, for short) found in all browsers.
In this post, I will walk you through the most common ways Developer Tools can help in your daily testing duties. The screenshots and details will be on Google Chrome, but the same features apply to most browsers.
How to Open the Developer Tools
Let’s start at the beginning. To use DevTools, you need to open them first (duh!). This can be done in multiple ways. I prefer the classic keyboard shortcut, which on Chrome and Windows is the F12 key. For Mac users, the keyboard shortcut is Option + Command + I (Ctr + Shift + I also works on Windows). The same combinations work for Edge and Firefox browsers.
Developer Tools have multiple tabs available, where you can work with different types of data from your website:
We will cover the most important ones for testing in a second.
Inspecting Elements
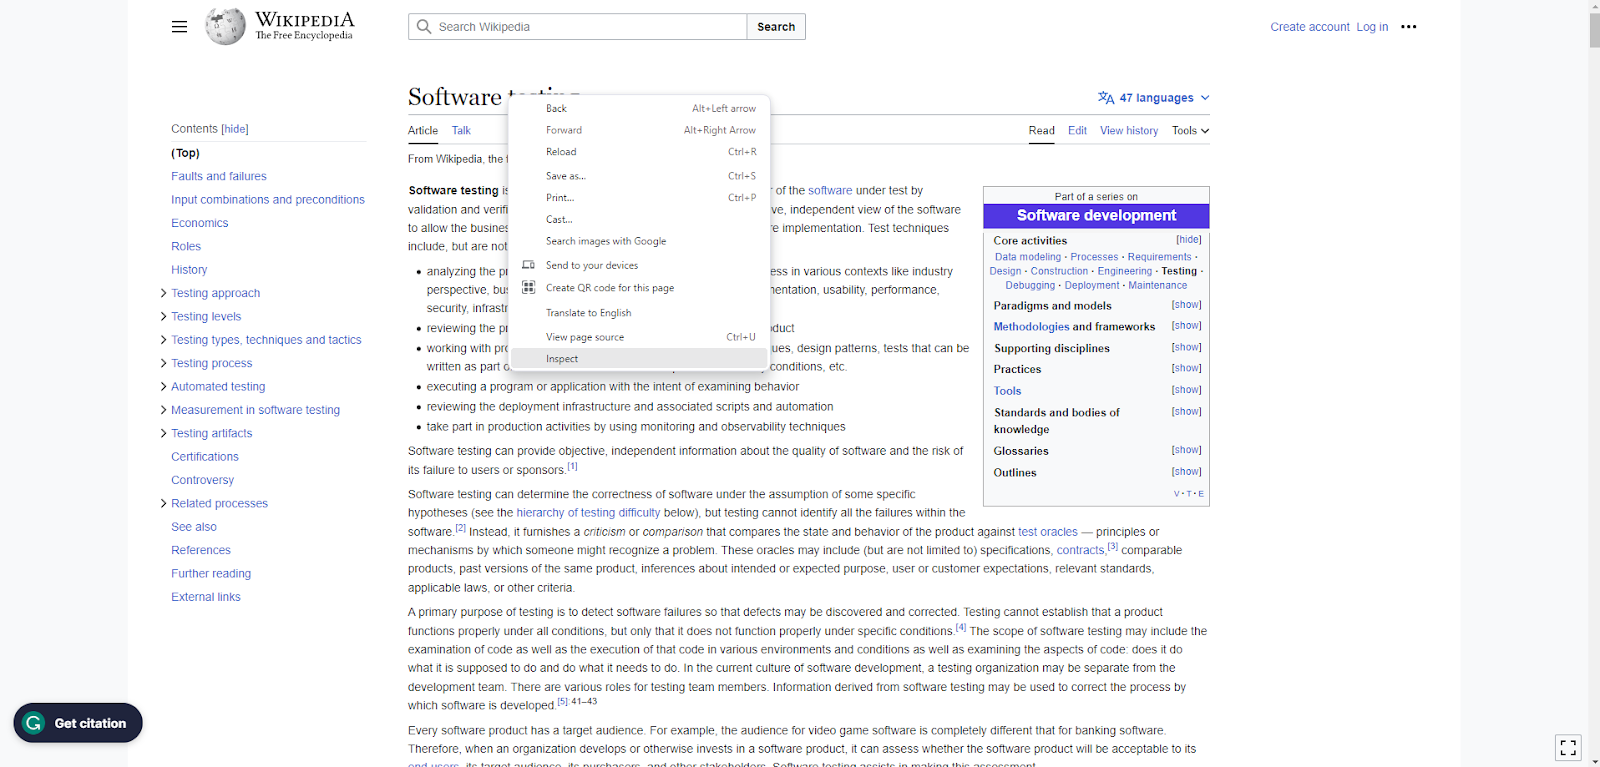
If you work with UI web automation tools such as Selenium WebDriver or Cypress, you’re likely familiar with the Elements tab of the DevTools. Just getting started? Then this is the right time to learn how to use it. You can also open the Elements tab by right-clicking on an element on the page, and selecting Inspect:
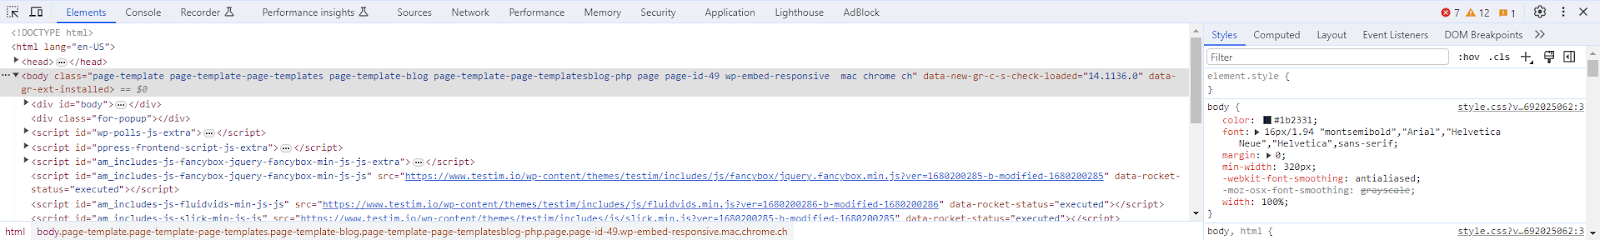
This will open the Developer Tools in the Elements tab and focus the selected element code. From here, you can see the web element information you need, such as classes, IDs, names, or build the CSS / XPath of the element:
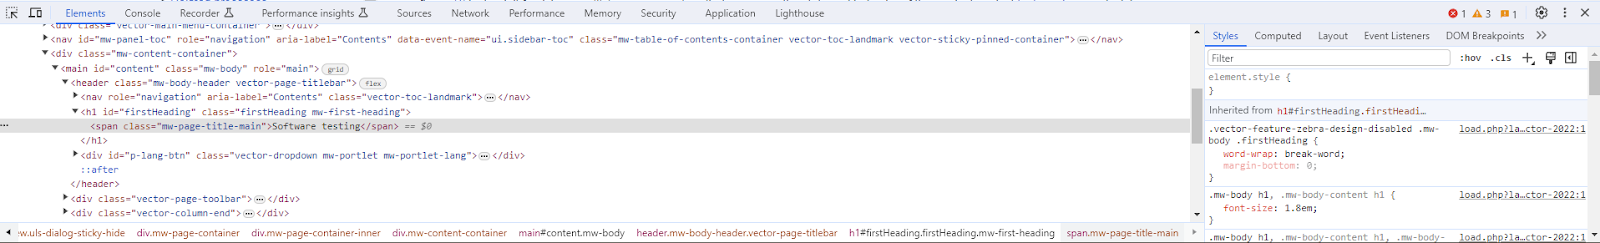
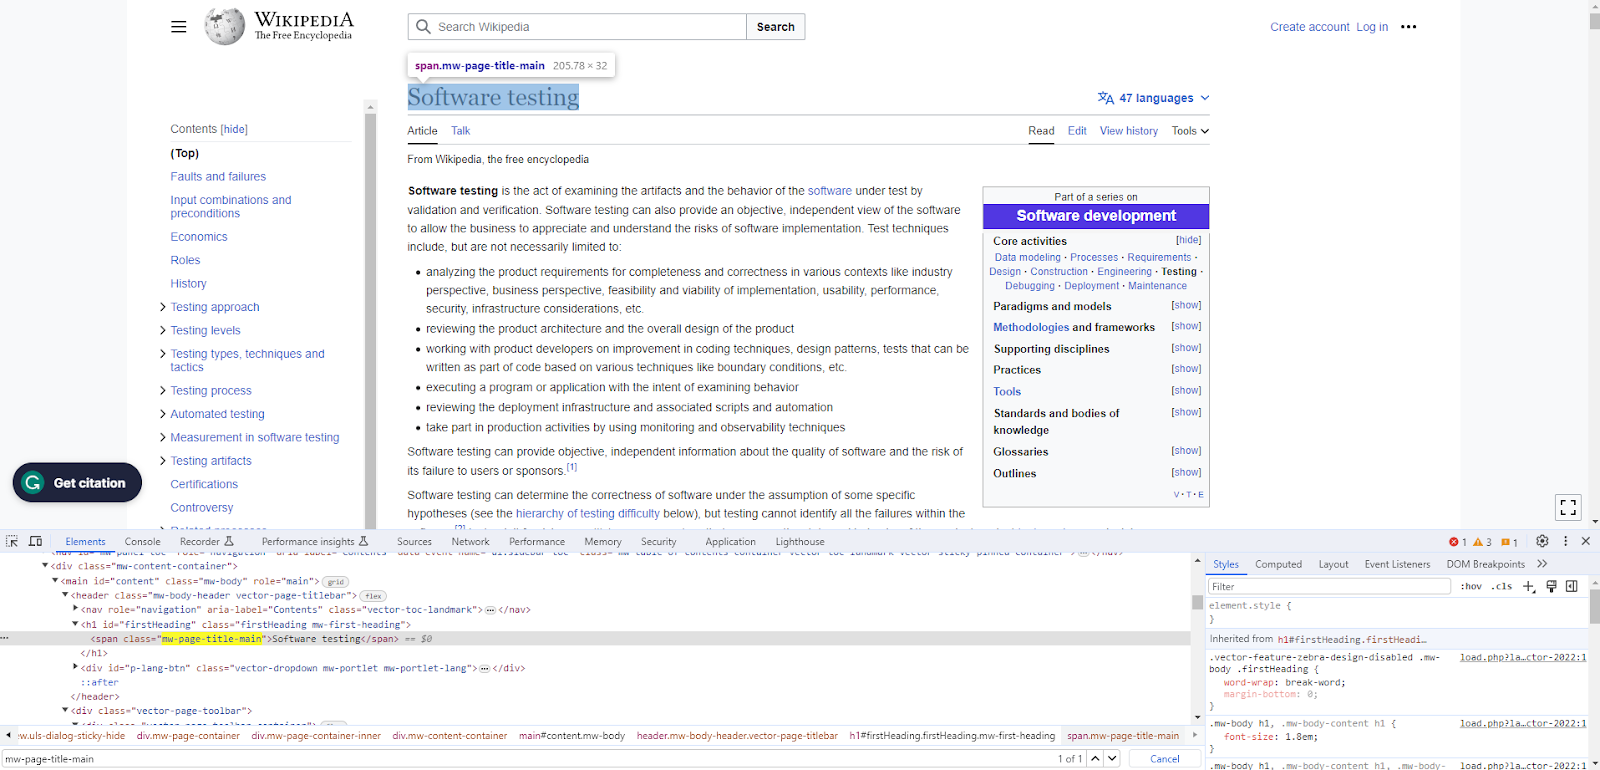
You can also use the search function in the Elements tab to look for elements by string, selector, or XPath. Hovering over the HTML node will highlight the element on the page:
I find this particularly useful when working with complex XPaths because I can see if the XPath identifies the correct element.
Just a small callout: I would not rely on the automatically created XPath or CSS selectors, but rather build my own based on the information I find in this tab. Then use the search function to see that the right element is identified.
Viewing HTTP Requests and Responses
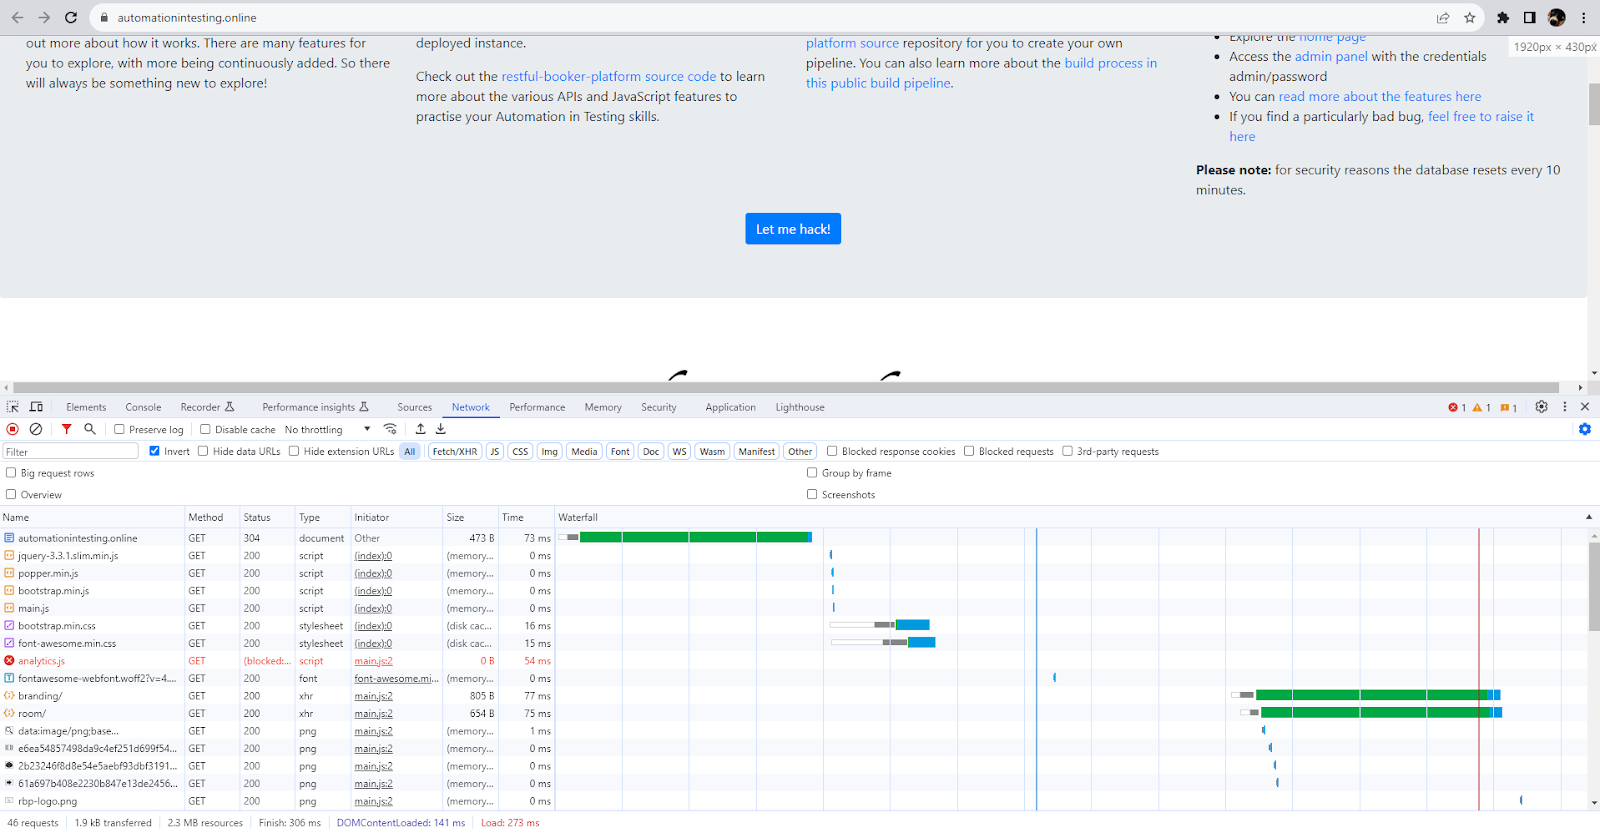
This is done in the Network tab, which is the DevTools feature I work with most when testing APIs. Here you can see which requests have been sent to the server, how long each request took, and what the response was. I’ll use the Restful-booker web platform to demonstrate. When the page loads, this is what you can see in the Network tab:
The Waterfall view can help you see the order in which the requests were sent and how long it took to receive a response. You can also see the details per request by clicking on the Name:
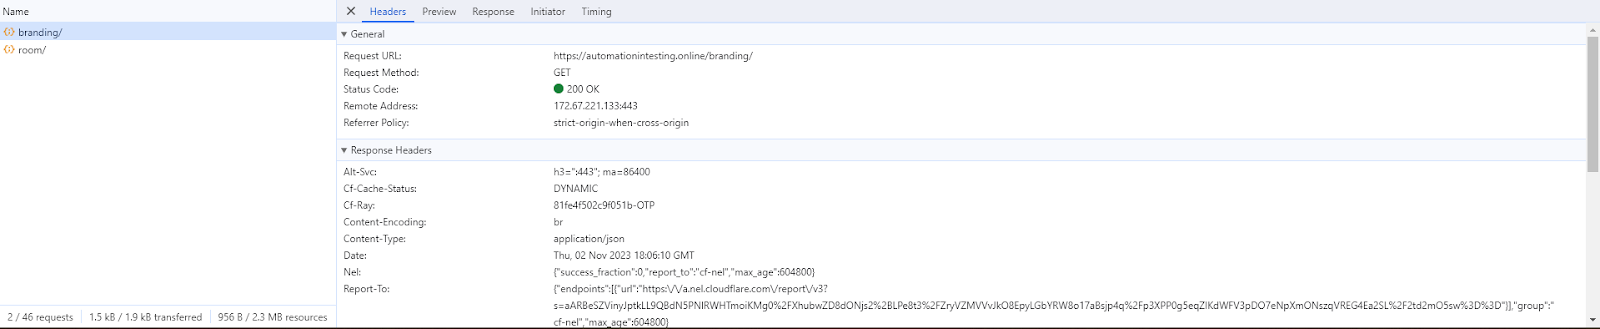
Here, you can see the Headers of the request and the response, the HTTP method used, the status code, the Response, and other useful information. This is helpful when you want to test whether the client sends the correct request or whether the server returns the correct response. It’s also useful if the application you’re testing has performance issues and you want to see which requests take the most time.
Performance Tracing
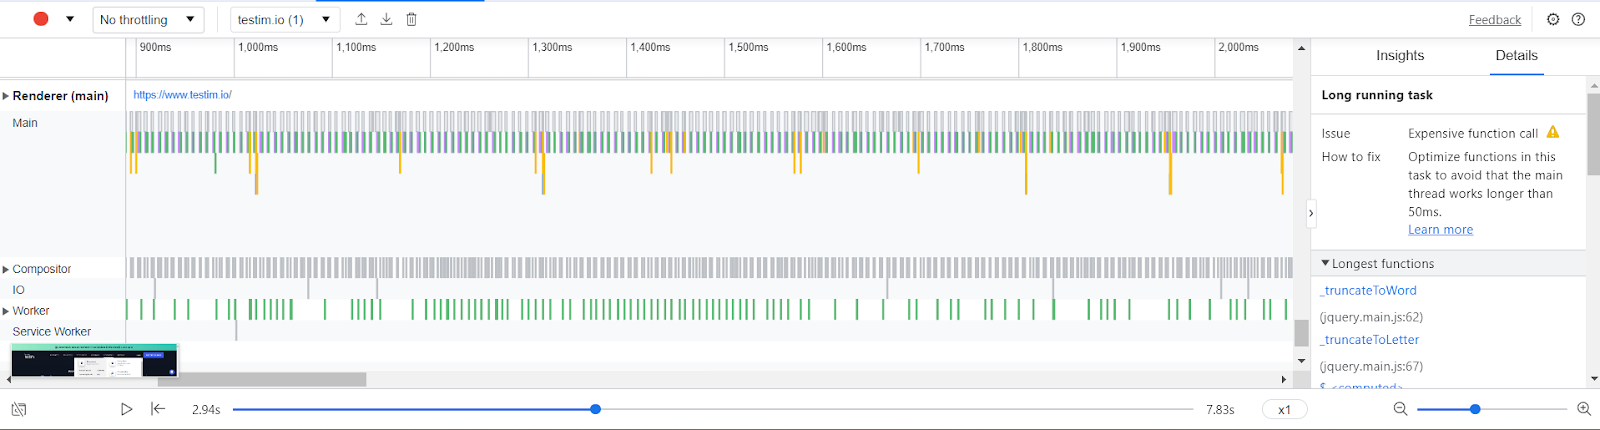
In addition to request tracking, a relatively new feature of DevTools is the Performance Insight tab, which offers information about the web app’s performance. You can record and play back a scenario, then view details about the events that occur while performing actions inside a web application. For example, you can see which actions take a long time, along with suggestions on how to fix them:
While I wouldn’t completely rely on DevTools for performance testing, it is a good first step for identifying potential issues before starting to incorporate more “serious” performance testing in your testing strategy.
Simulating Slow Network Connections
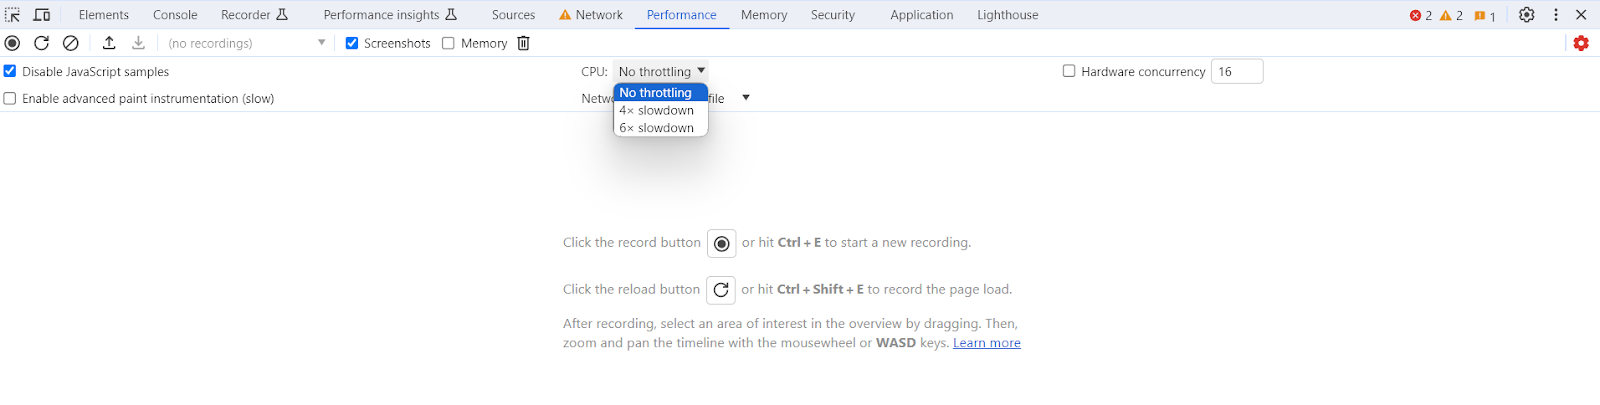
Speaking of performance, if you need to validate the AUT works as expected, even in not-so-ideal conditions, you can simulate a slow network connection from the Developer Tools without having to interfere with your actual connection. This can be done from the recording option described above from the old Performance tab or the Network tab. You have the option to make your CPU operate slower than normal:
Or simulate a slow 3G connection and even go offline:
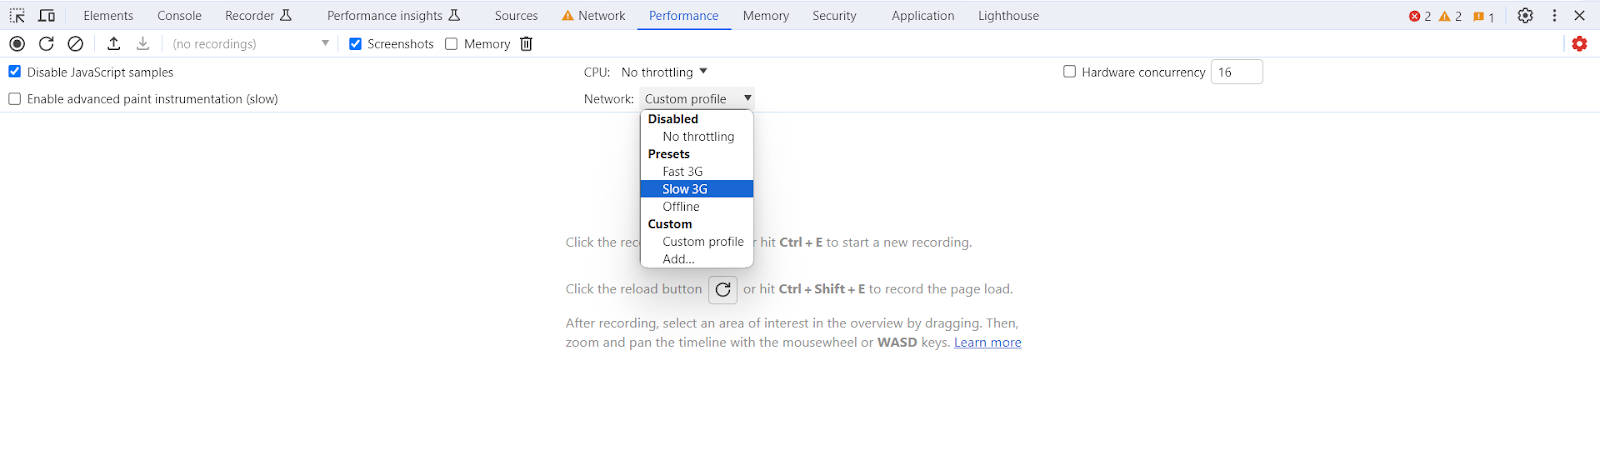
This sort of test reveals interesting information about how the application may behave on slower devices or when the users are working with it while temporarily losing their Internet connection.
Emulating Device Settings
From the settings menu, you can select Devices and see how the application looks and how you can interact with it on different pre-set devices. You can also use your own custom setup:
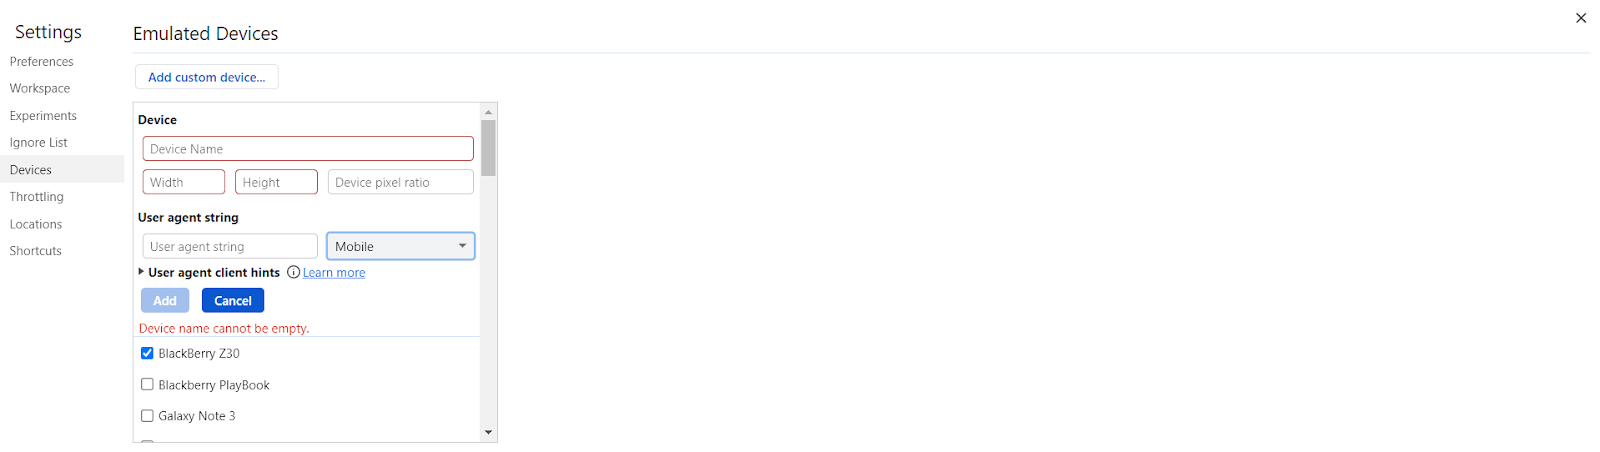
This does not replace testing on a real device or using a simulator or emulator, but if you don’t have access to those, this DevTools feature can give you an idea of how the application looks and feels on a device other than a desktop browser.
Emulating Different Geographical Locations
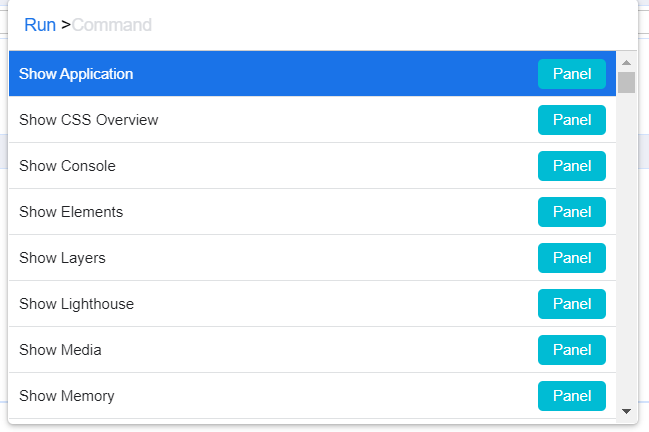
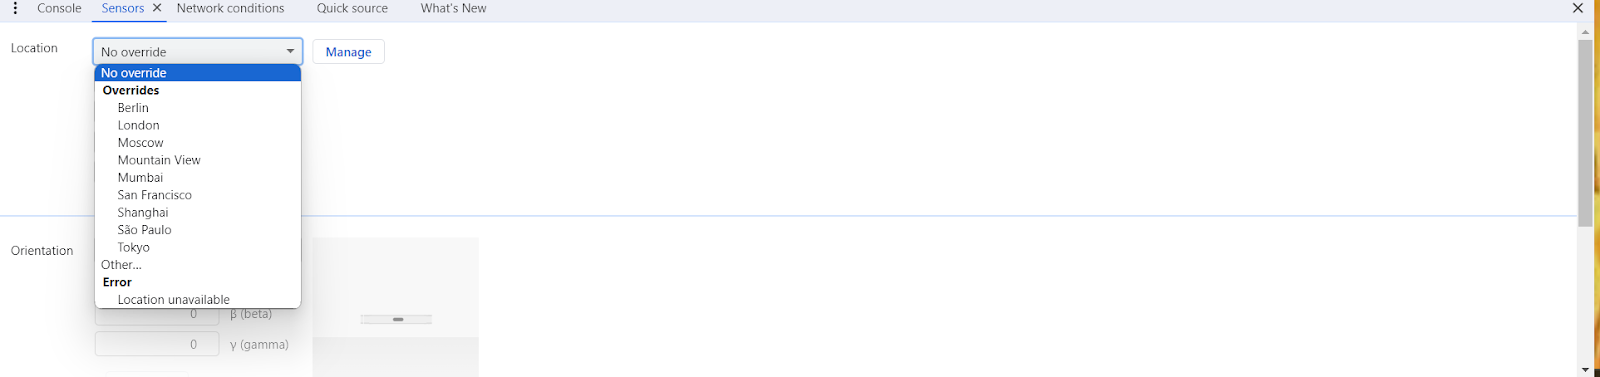
Last in the DevTools arsenal is Location. You’ll find this under the Settings menu, where you can pre-set list of locations with details such as timezone, latitude, and longitude. When you send this information, some websites or web applications will show different data depending on the user’s location. If you want to test how different users from various locations can work with the application, you can override your settings to test this. For this, you first need to open the Command menu (done with keyboard shortcut Ctr + Shift + P for Windows, or Command + Shift + P for Mac):
Here, type “Show Sensors” and select the available option:
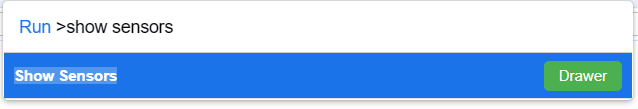
This opens a new menu where you can select to override your current location:
Conclusions
Developer Tools can be a good ally for a tester’s work, and it’s important that we know how we can take advantage of what they have to offer. This blog post only covers some of the main features of DevTools for testers, but if you’re hungry for more, check out full documentation for Chrome, Firefox, Edge, and Safari.


