

")
The tech industry is currently more competitive than ever. In order to stay competitive, software organizations had to evolve. They had to adopt tools and techniques that allow them to move fast while keeping quality high.
In short, that’s what the DevOps movement is all about: bridging the lines between development and operations, leveraging automation to its fullest extent to deliver software as fast as possible without breaking what’s already working well. Test automation certainly plays a role in all of that: it is the key to implement a CD pipeline.
Another very important piece on that cog is leveraging tools and techniques that can improve the quality of your code. Linters, for instance, are virtually indispensable if you’re really serious about code quality. Practices such as refactoring are also immensely valuable.
In today’s post, we examine a comprehensive tool that can help you improve your JavaScript code: SonarQube. Code coverage, bugs, and security vulnerabilities are just some of the factors you can measure—and improve—by adopting this tool.
We’ll start with some fundamentals on SonarQube. You’ll understand what this tool is and why you should care about it. Then, we move on to cover some of the features that SonarQube offers for JavaScript codebases. By this point, I bet you’ll have your hands itching to roll up your sleeves and actually do something. Well, since your wish is my command, that’s exactly what we’ll do in this section. You’ll learn how to download SonarQube, how to create a JavaScript project using it, and how to run the scanner to start detecting bugs and other problems.
Let’s dig in!
SonarQube Fundamentals
SonarQube was first designed to provide developers with a tool to scan their code for bugs, code smells, or security vulnerabilities. However, the goal of SonarQube has changed over the years. SonarQube attempts to provide developers with early security feedback for the code they’ve written, thereby powering the agile movement in software development. Besides that, the idea is that developers write more secure code in order to reduce the cost of doing intensive bug fixing at the end of a project.
This article will teach you about the SonarQube JavaScript features available to you. You’ll find out how to install SonarQube and run the SonarQube scanner on a JavaScript project. Then we’ll explore the analysis results.
Let’s get started by exploring SonarQube JavaScript features.
Expand Your Test Coverage
SonarQube JavaScript Features
SonarQube performs static code analysis for almost any type of project. It provides you as a developer with a detailed report about bugs, code smells, security vulnerabilities, and code duplications.
Besides these core functionalities, SonarQube offers many other interesting features.
Feature 1: Multi-Language Support
By default, SonarQube supports 27 programming languages. These include Java, JavaScript, C#, Python, Golang, HTML5, CSS3, PL/SQL, and many more. Besides scanning code and finding bugs in your code, it also helps you to understand those issues by providing meaningful descriptions. The idea is that you can take immediate action to solve the bug based on the description.
Feature 2: Detection of Tricky Issues
SonarQube helps you spot complex issues that are hard to notice by just looking at your code. For example, SonarQube can help you find incorrect code or code that causes unintended effects. It does this by navigating code paths and combining information from multiple code locations. SonarQube uses path-sensitive dataflow engines in combination with static code analyzers to detect such bugs.
Besides bugs, it helps you to find code smells. The official SonarQube documentation defines a code smell as: “Smelly” code does (probably) what it should, but it will be difficult to maintain. In the worst cases, it will be so confusing that maintainers can inadvertently introduce bugs. Examples include duplicated code, uncovered code by unit tests, and too complex code.”
Also, SonarQube looks for security vulnerabilities. Examples include hard-coded passwords, badly managed errors, or even SQL injection opportunities.
Feature 3: Continuous Integration Abilities
Instead of manually executing SonarQube as part of your development routine, it makes much more sense to automate code analysis. Therefore, SonarQube offers integrations into your continuous integration workflows like Jenkins, Azure DevOps, Bamboo, TeamCity, and AppVeyor.
If you aren’t using any of these continuous integration tools, you can still integrate SonarQube into your workflow using the SonarQube WebAPI and its webhooks.
You can learn more about test automation best practices at Testim.io.
Feature 4: Quality Gate
Finally, every project will receive an overall quality label based on elements such as the number of bugs, code smells, test coverage, and code duplication. You can use the quality gate label to determine if the quality of your code is high enough to be released. Indirectly, SonarQube helps you protect your reputation by releasing safe code only. You can read more about quality gates here.
SonarQube JavaScript Issues
Let’s briefly show some examples of issues that SonarQube can detect on your code.
Unreachable Code
Also called “dead code”, this issue indicates you have some code that will never execute. Here’s an example:
function add(numbers) {
    let parts = numbers.split(',');
    let result = 0;
    let negatives = [];

    for (var p of parts) {
      let number = parseInt(p);
      if (number < 0) {
        negatives.push(p);
      } else if (number <= 1000) {
        result += number;
      }
    }

    if (negatives.length > 0)
      throw new Error("Negatives not allowed: " + negatives);
    else
      return result;

    return "a different result";
}
In the example above, the code will either throw an error in the case of negative numbers, or it won’t. So, the last line is unreachable and would be detected as so by SonarQube.
To fix the issue, you’d have to either delete the offending line or change the code that preceded it, to make it no longer an unreachable line.
Always True Condition/Always False Condition
This issue is easy to understand. It happens when you have an if statement with a condition that always evaluates to either true or false. The following example illustrates the issue, with a condition that will always evaluate to false:
let numbers = [9,7,5,4,8,2,3];

while (numbers.length > 0) {
  console.log(numbers.pop());
}

if (numbers.length > 0) {
  console.log("This line will never execute");
}
Issues like that can be solved by either removing the if statement altogether or fixing its condition.
Both Branches Are the Same
For this last example, I won’t even provide a code sample, because it’s very easy to understand. It refers to the scenario in which both branches of an if statement contain the same code. This could happen, for instance, if an engineer commented out code from one of the branches, leaving just one line uncommented, which is the same as the line in the other branch.
In such a scenario, if the commented out code isn’t really needed, you could get rid of the whole if statement. Otherwise, uncomment the lines to remove the issue.
Install SonarQube With Docker
Let’s install SonarQube. To keep things simple, we’ll opt for a straightforward install using a SonarQube Docker image.
You can pull the Docker image from Docker Hub, where you can find all instructions as well. We’ll be using the open source Community Edition of SonarQube. Let’s get started!
Step 1: Pull Image
First of all, pull the Docker image to your local machine with:
docker pull sonarqube:latest
Step 2: Start SonarQube Server
Next, create an instance of the SonarQube image you just pulled. The following command will start the SonarQube server.
docker run -d --name sonarqube -p 9000:9000 sonarqube
The command creates the server and exposes the SonarQube GUI on port 9000 on your host machine.
Step 3: Access SonarQube GUI
To access the SonarQube graphical user interface, navigate to localhost:9000 in your web browser. As soon as you access the SonarQube GUI, you’ll be redirected to the login page. This is due to a security feature called Force User Authentication. It’s possible to disable this setting afterward if you feel like it. But keep in mind that doing so exposes you to some security risks.
By default, you can log in as admin with password admin.
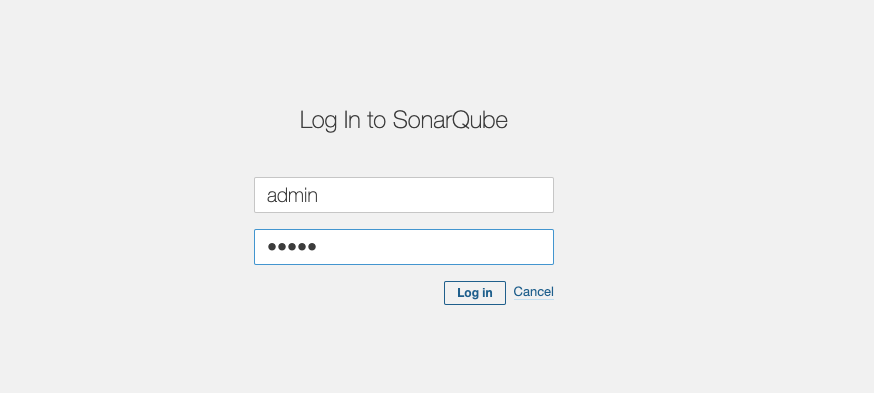
After you log in, you’ll be prompted for changing the admin password. Then, you’ll see the full GUI and be able to create a new project.
Create a SonarQube JavaScript Project
In this section, we want to configure a SonarQube JavaScript project. You’ll see the following screen:
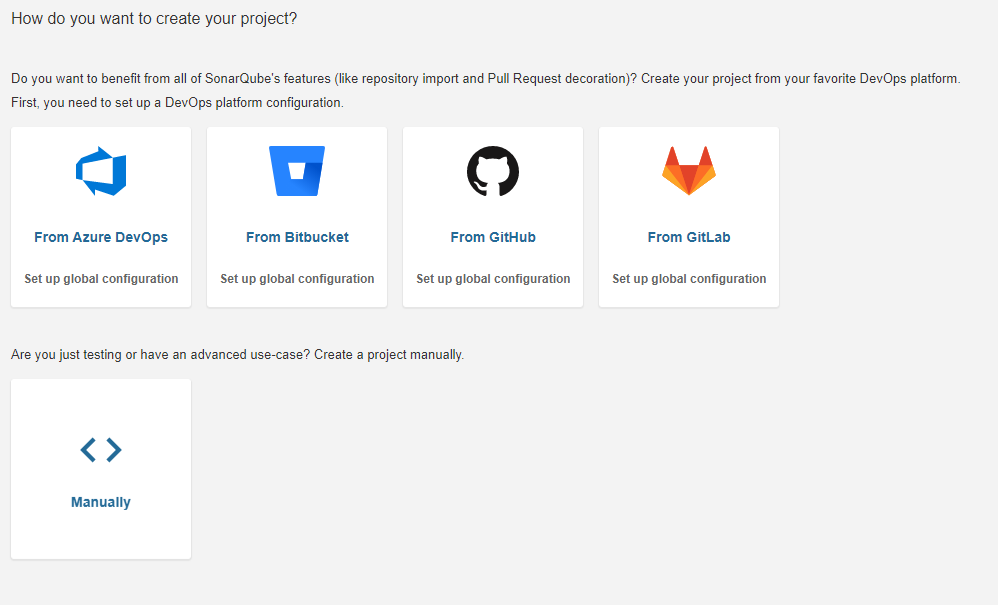
As you can see, you have the option to start a project from several DevOps platforms, such as GitHub, Bitbucket, and more. We won’t be doing that, though. To get started with a new project, hit the Manually option.
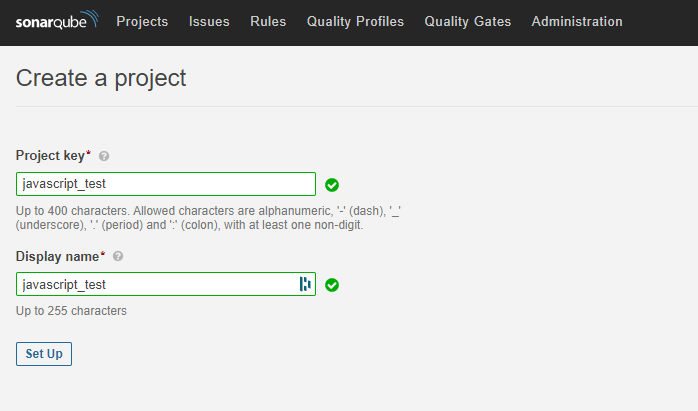
Next, you need to input your project name. It’s OK to use the same name for the display name field. Once you’re finished, hit the Set Up button.
Then, Sonarqube will ask you how to you wish to analyze your project:
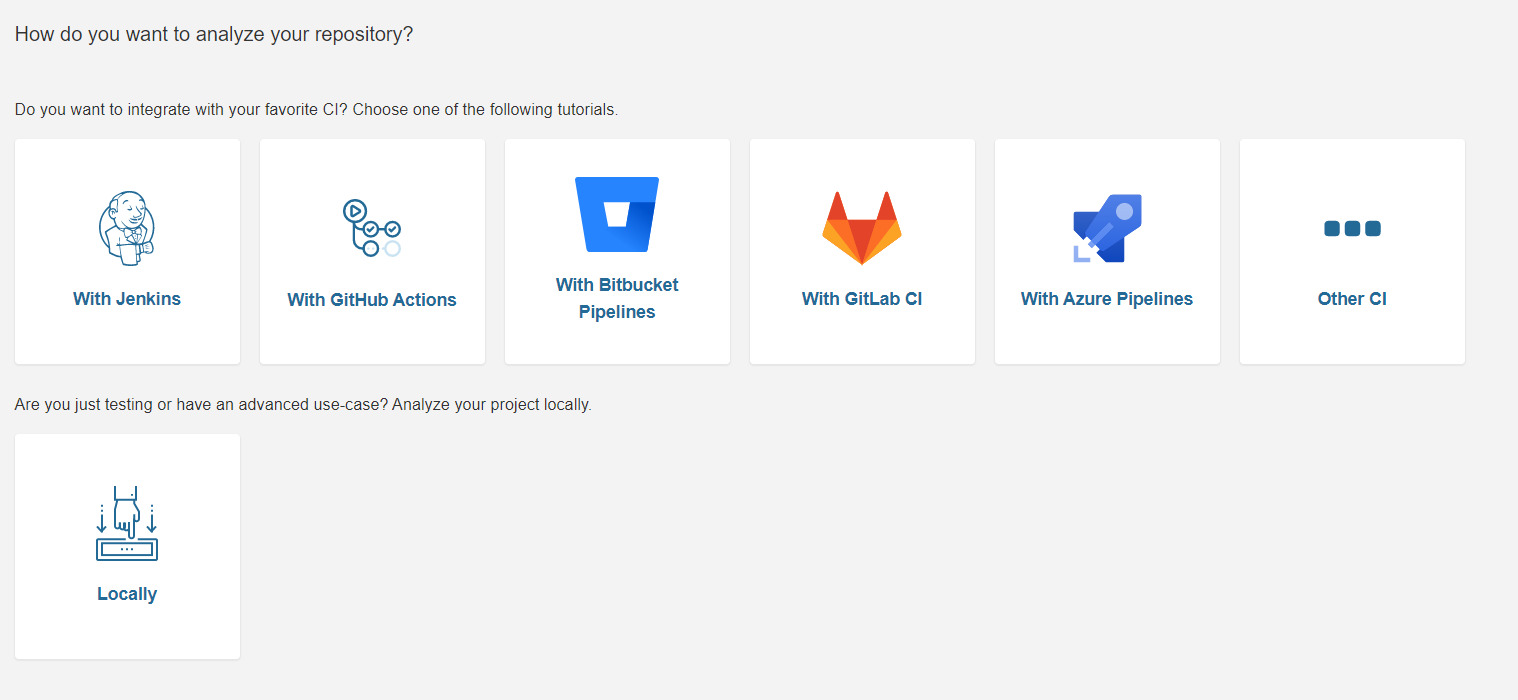
Go with Locally.
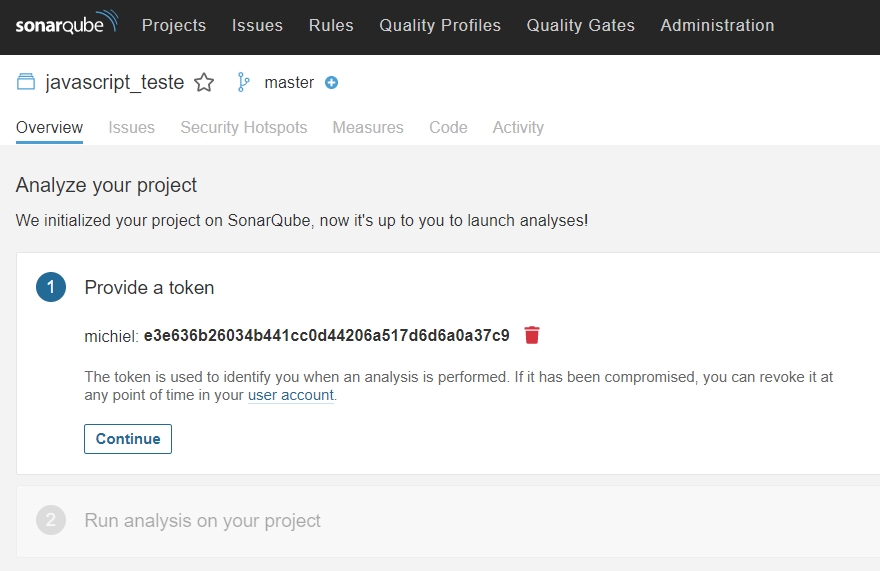
In the next step, you have to generate a unique token that will be used later on for uploading the analysis results to the SonarQube GUI. You can input any string for generating a token.
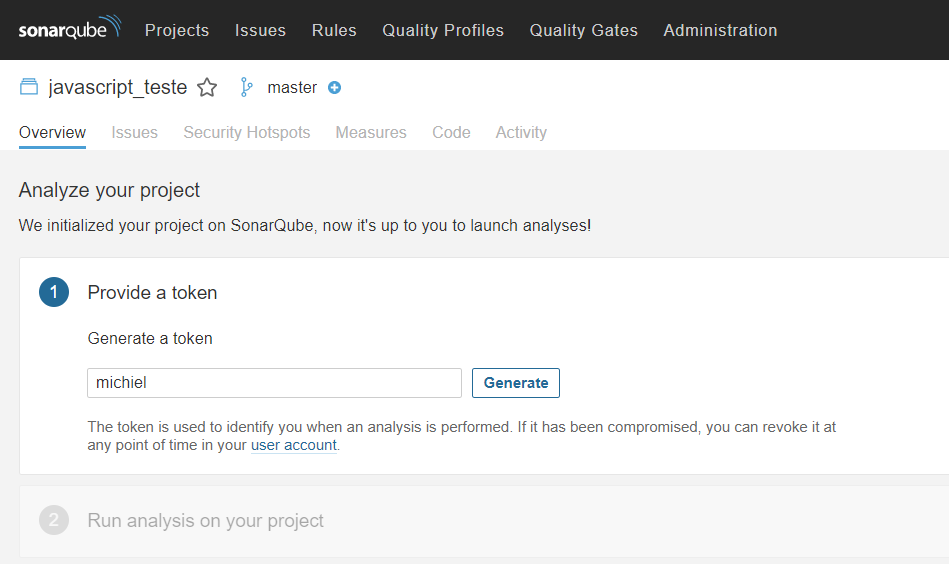
The token will display in your browser, but you don’t have to do anything with it yet.
Next, you need to set up the multi-language scanner for analyzing your JavaScript project.
Set up the Multi-Language Scanner
It’s time to set up the multi-language scanner. As you can see in the image below, you have to select the type of project you want to analyze. Select the “Other” option as you want to scan JavaScript code. After that, select the operating system you’re using. In my case, this is MacOS.
You’ll see a download button that directs you to a download page where you can download the SonarQube Scanner.
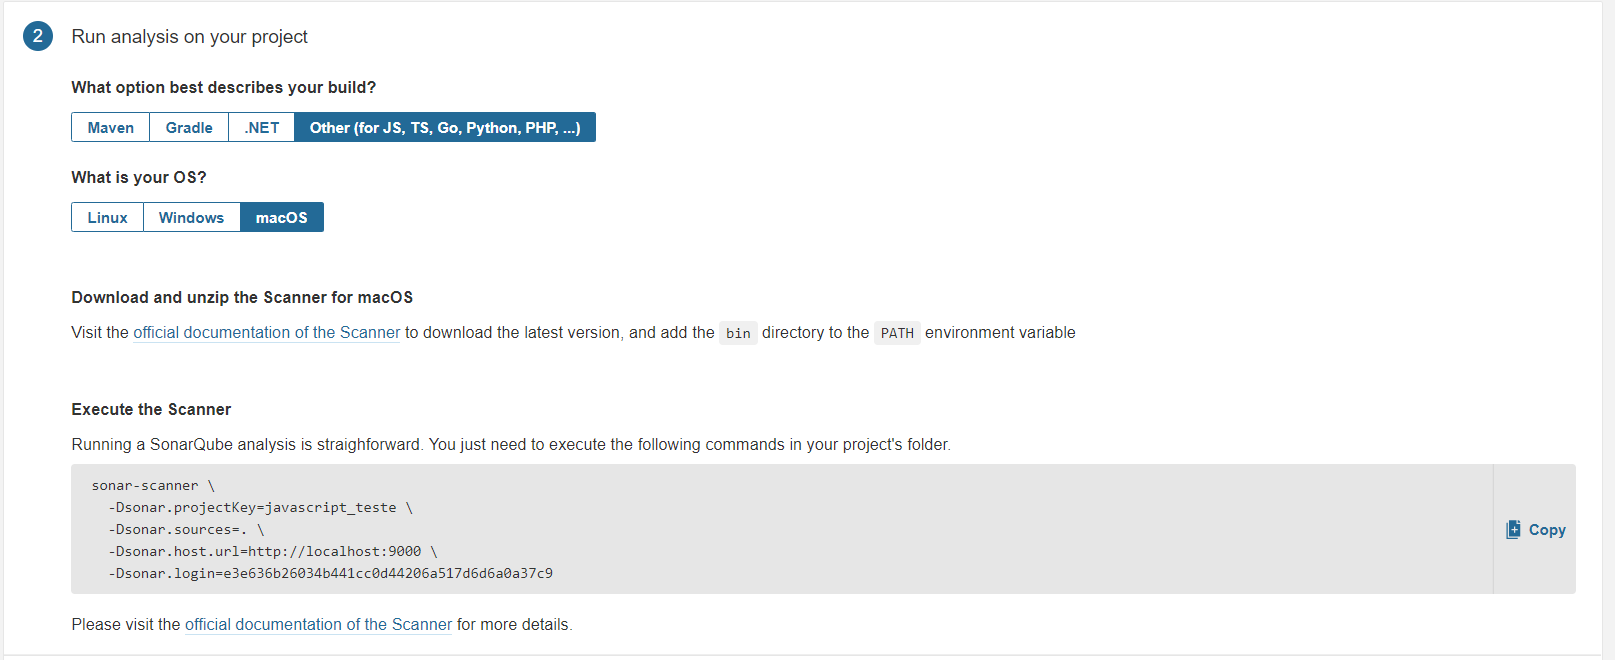
To be able to use the sonar-scanner command, you have to add the path to the executable to the PATH environment variable. You’ll find the bin folder after unzipping the scanner. This full path needs to be added.
Here’s an example for MacOS:
export PATH=$PATH:/Users/michiel/projects/sonar-scanner-4.2.0.1873-macosx/bin
If you’re on Ubuntu, add the path to your ~/.bashrc file.
On Windows, you’re probably more safe going with a GUI-based route. Press the Windows key, then type “path.” You’ll see something like this:
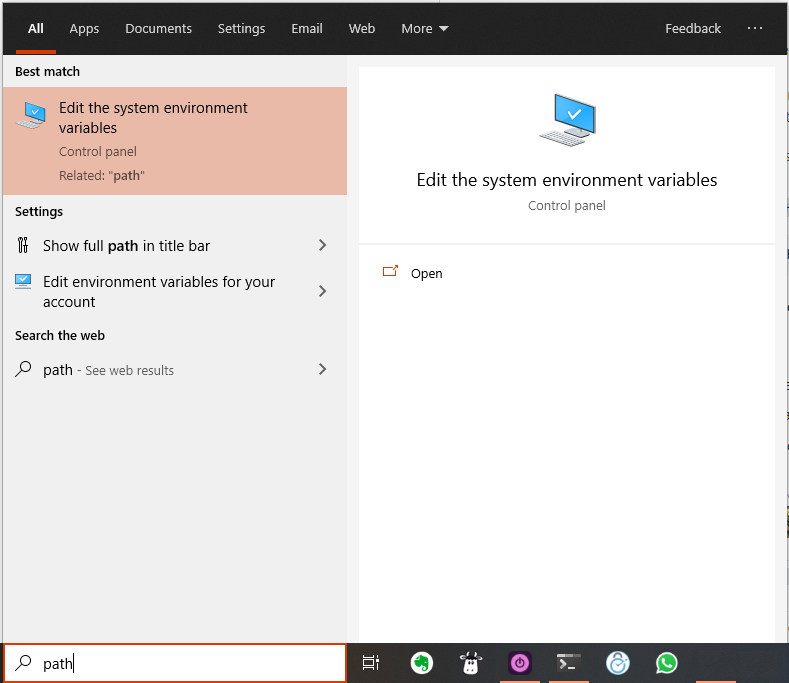
Then, you should click on the highlighted result you see above.
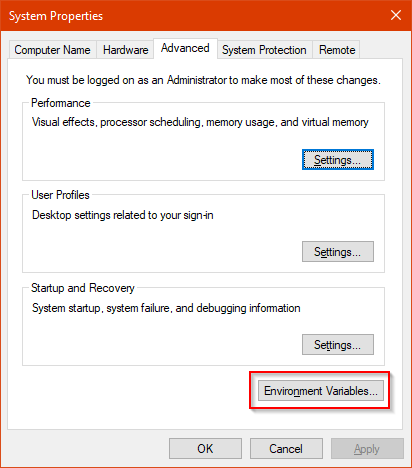
A new window will show up. Click on Environnment Variables:
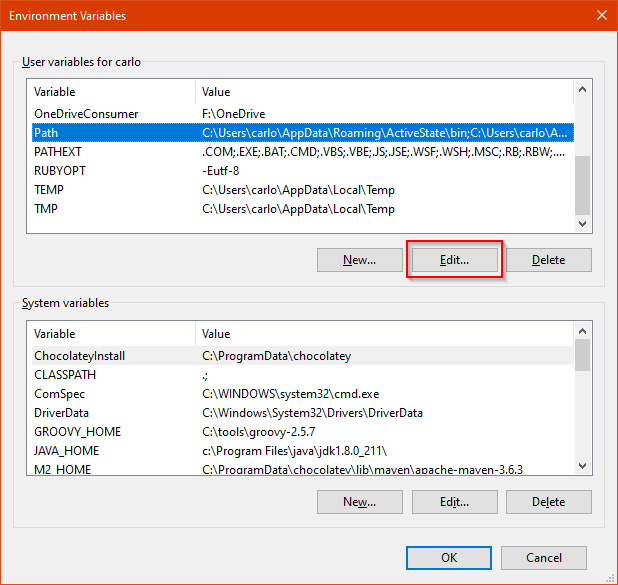
Yet a new window will appear. On that window, go to the first listing, and find the PATH variable. Then, click on Edit:
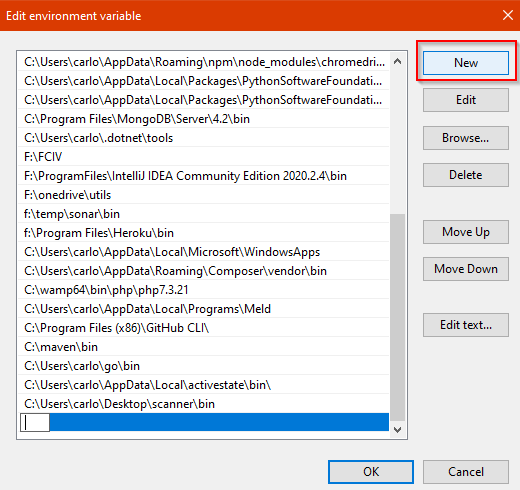
On the new screen you’ll see, click on New, and then enter the complete path for the folder. Click on OK, and you’re done!
You’ve finished the setup! Let’s continue by running the scanner.
Running the Sonar-Scanner
Notice the command at the bottom of the image from the previous section. This command needs to be executed inside your project folder. The command holds the generated token (Dsonar.login field) to access the SonarQube GUI to upload the results.
I’ve prepared a sample project that holds two bugs in the code. You can clone the code locally through this link or use your own project.
Next, navigate inside your project, and run the command from the image above inside your terminal:
sonar-scanner \
 -Dsonar.projectKey=javascript_test \
 -Dsonar.sources=. \
 -Dsonar.host.url=http://localhost:9000 \
 -Dsonar.login=33525f953e88b4ab249df04cc2dcd83cb7782043
Of course, don’t forget to replace the values of projectKey and login with your own values. Once the command has finished, head over to your SonarQube GUI at localhost:9000.
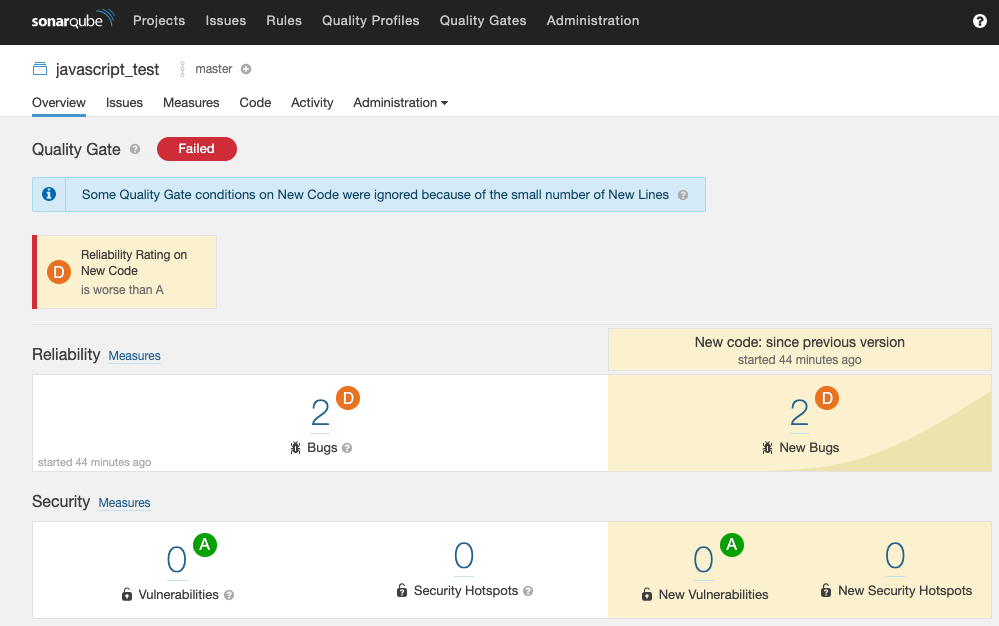
Analyzing Scanner Results
The scanner results page shows the overall quality label. It’s set to “failed” because the code contains two bugs. This means the code isn’t ready for release.
Let’s explore some elements of the report.
Bugs
When you enter your project, notice that the scanner found two bugs. It didn’t find any security vulnerabilities.
It’s possible to expand the bugs and examine the affected lines.
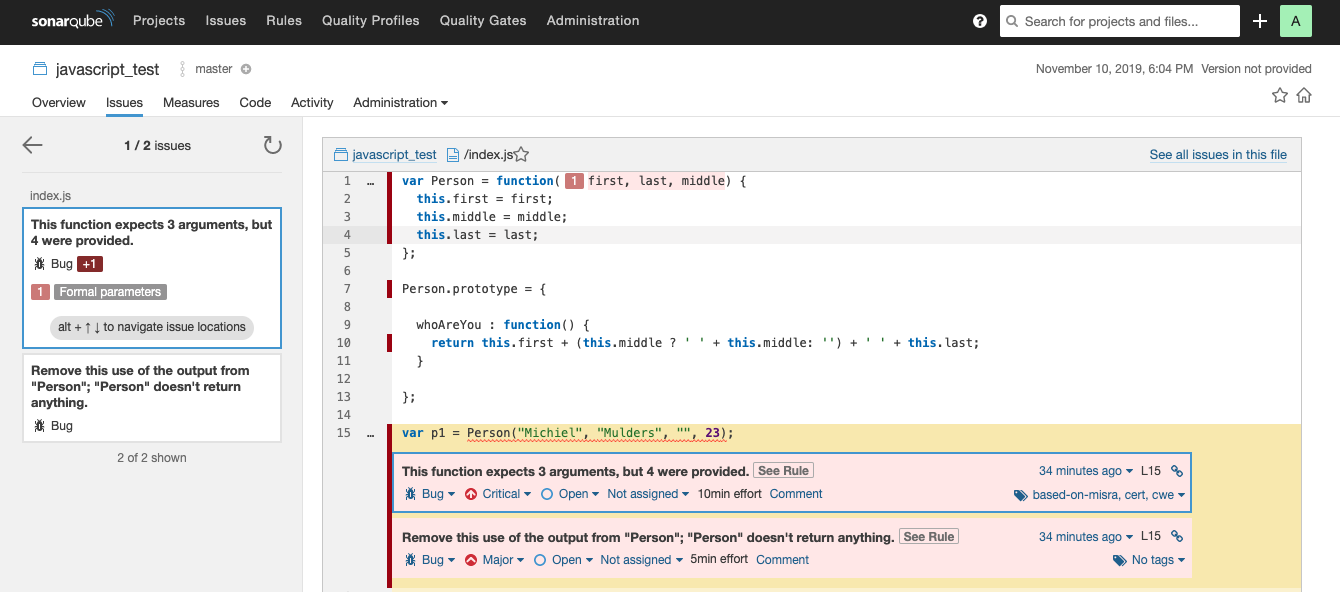
If you examine the first bug, you’ll see that you’ve created a function that accepts only three arguments. However, you call the function with four arguments, which is incorrect. Here, SonarQube comes in handy to find such bugs.
Let’s discuss some of the metrics SonarQube displays.
Metrics
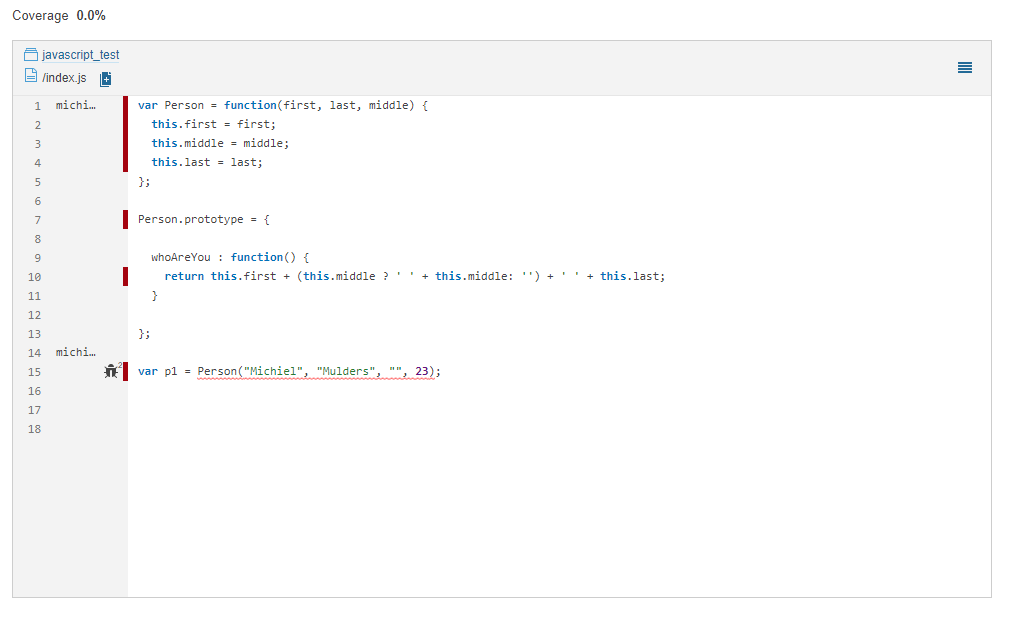
SonarQube measures code quality based on different metrics. The most important metric is the code coverage metric. In this case, no tests have been written, which means you have no code coverage.
The cool thing about SonarQube is that it indicates the number of lines that aren’t covered by tests. If you take a look at the index.js file (below image displays code for index.js) of your sample project, you’ll find that seven lines of code need test coverage.
SonarQube measures many other metrics as well. Feel free to explore further! You may want to check out metrics such as reliability or maintainability, which help you determine the quality of your project. You can also find more information about software quality challenges in the following blog.
Ignoring Files/Folders on SonarQube
Before parting ways, let’s share a final tip on working effectively with SonarQube. When performing source code analysis, you’ll often find yourself in need of skipping certain files or even entire directories. For instance, you might have files that are automatically generated and, as such, any edits done to them are lost once they’re recreated.
Fortunately, SonarQube allows you to customize to a great extent the details of what gets analyzed. You can either ignore some files or folders completely, or you can choose to exclude files/folders in the analysis of certain aspects, while still including them in others. For instance, you can exclude a folder from code coverage analysis while still having it analyzed under other aspects. SonarQube also allows you to configure those exclusions both at the local and at the global level.
Here’s an example. Suppose your project has a foo folder inside src, and you want SonarQube to completely ignore it. One solution would be to add the following line to your sonar-project.properties file:
sonar.exclusions=src/foo/**
The sonar-project.properties file is a plain-text configuration file you can add to the root of your project, so you can configure SonarQube’s properties at the project level.
Hey, Dev: Take a Bad Code, and Make It Better
SonarQube is a great tool for statically analyzing your code in order to detect bugs, code smells, or security vulnerabilities. The tool is easy to set up for a JavaScript project and can integrate with continuous integration/continuous delivery tools.
For me, the Quality Gate provides a lot of value, as it tells the project owner if the code should be released or not.
You can learn much more about SonarQube:
- Learn how to disable, enable, or extend coding rules for SonarQube.
- Learn more about the SonarQube metrics.
This post was written by Michiel Mulders. Michiel is a passionate blockchain developer who loves writing technical content. Besides that, he loves learning about marketing, UX psychology, and entrepreneurship. When he’s not writing, he’s probably enjoying a Belgian beer!


