


Testim by Tricentis, originally named Testim, was created in 2014 to help anyone author automated tests. At the time, Selenium was king and tools to help any QA or team of developers and automate their tests (e.g. Cypress, Puppeteer, and Playwright) were science fiction.
The beginning
In the beginning, Testim’s primary audience was QA engineers who wanted to avoid all the hassle in automation—grids, schedulers, edge cases in browsers like IE or Safari. As Testim evolved, so too did the audience using it. Our next big constituent? Developers.
Yes, the same developer who wears shorts, rocks a cool t-shirt from their last conference, and commands a long beard (probably). However, getting a developer out of their comfort zone can be hard, if not an outright fairy tale. To a developer, the idea of expressing a test in anything other than code is frightening. Let’s call these developers the “dev persona.”
How we approached our new audience
To better engage the dev persona, features like custom actions and command-line interface (CLI) steps were created to address use cases Testim typically wouldn’t handle. Even after shipping these cool features, one major pain point for developers remained: debugging failed tests. But before we dig into how failed tests are debugged, how do we get developers comfortable with writing tests?
Developer and QA – part two
As you may remember from my earlier blog post, I talked about how developers shouldn’t fear QA. This process calls for involving developers throughout the QA process, starting with writing the software test plan (STP) for a feature and extending to automating the test:
- First, the developer must talk with a QA engineer to learn how to think like a QA engineer. For example, if we have an API that receives a number in the payload, the obvious thought is “OK, let’s just check that the number is not empty and finish.” But an API payload could receive strings and objects or even a number that is not in the range of the constraint.
- Second, once we understand how a QA engineer thinks, we as developers can adapt our approach to writing a feature, effectively improving the feature itself and how we build in the future.
- Third—and this might be the most important—we learn how other people think and get to know other people in the company, which can be just as important as delivering a high-end feature.
Meet Testim’s new features
I hope I can get my fellow developers excited about writing STPs. After all, we share the same mission—taking our organization (or groundbreaking startup) to new heights to disrupt the industries we work in. Let’s now talk about some of the new tools you’re adding to your toolbox with Testim:
Debugging 2.0
This new set of debugging features will take you to the moon and back—and dazzle like a new clip from Lady Gaga. First, the navigation between steps is greatly improved, visually appealing, and easy-to-use, just like your familiar debugger:
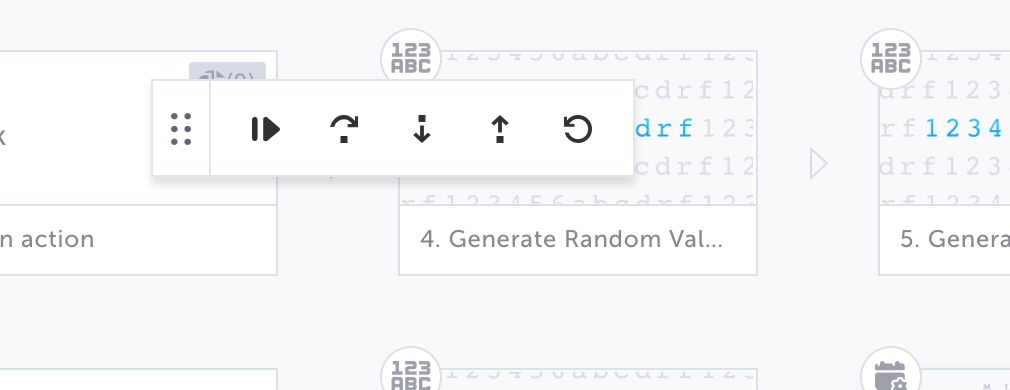
Viewing the different steps and finding the one of interest is much easier while actively debugging. In addition, you can drag and scroll across the steps in the navigator editor while working to debug steps without any risk of interfering.
And here’s the cherry on top—when debugging a custom step, the test will pause, highlight how to open Chrome DevTools, and show how to debug the code, just like any other code debugger. That’s right! No more transposing the code elsewhere. No more switching away from the test and the page being executed.
Logs, logs, logs
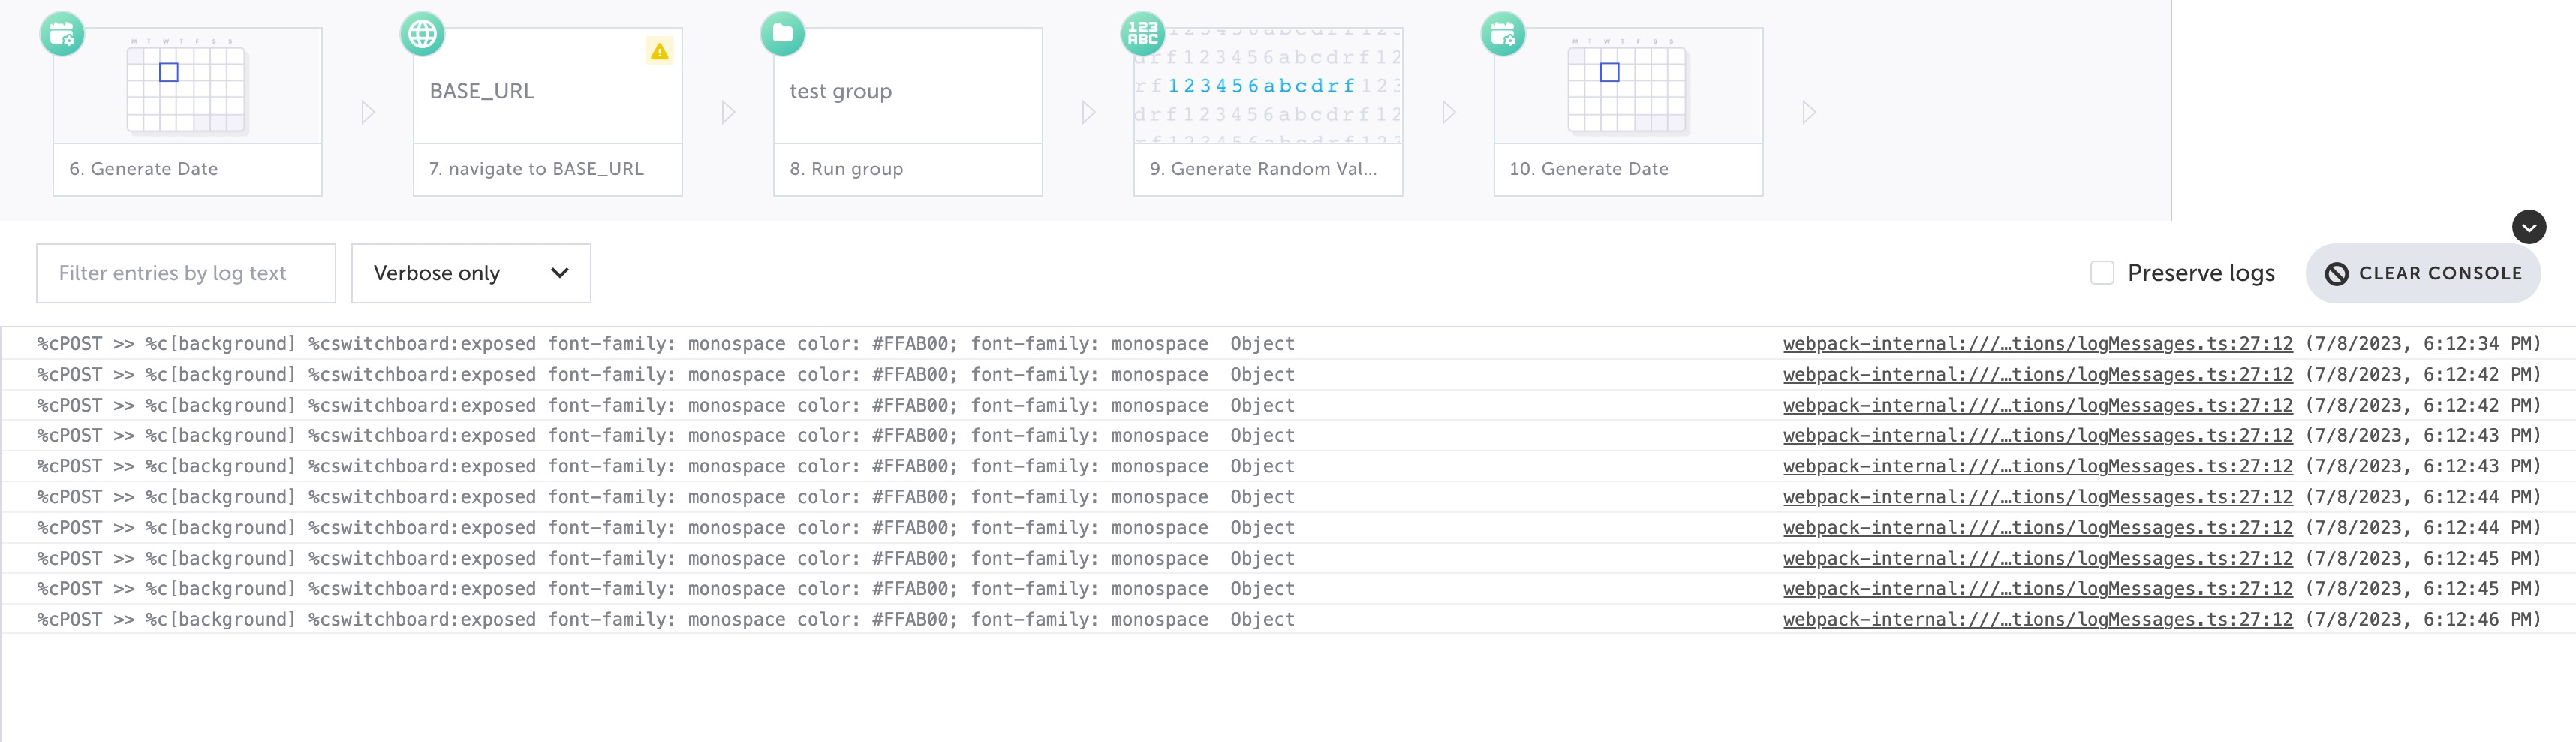
Everyone does it—we put console logs in our front-end application to see what’s going on with our custom code and if we are developing a feature, we might temporarily put some console logs in our code base (pro-tip: don’t forget to remove them before merging). Before, we could only view the logs after the test concluded. Now, as the test progresses, the logs will actively appear in the shiny console at the bottom.
Scope
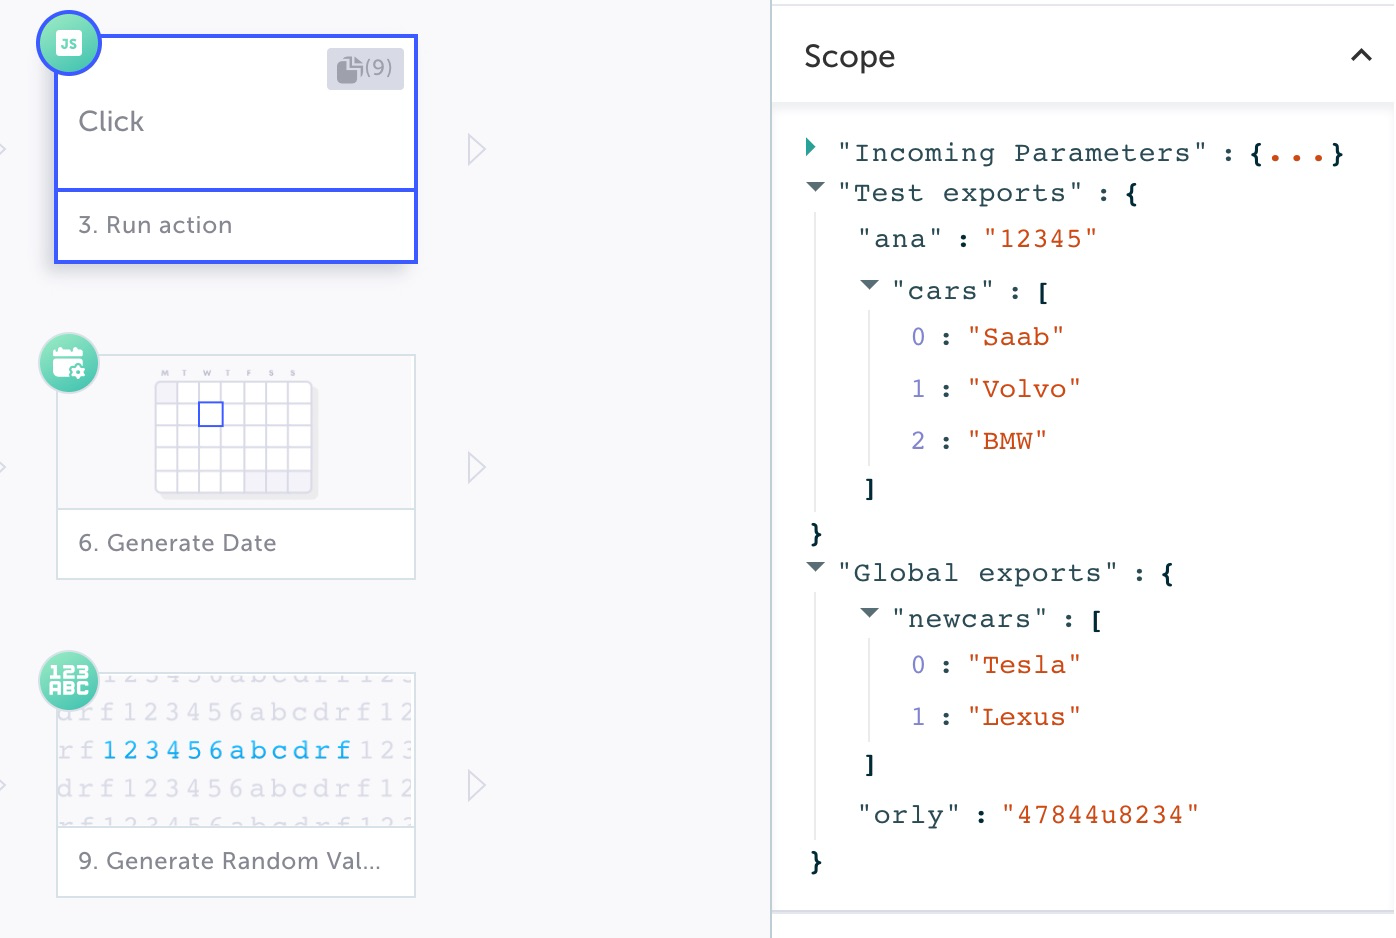
We know, we know. The step parameters were not the best representation of data we had. And even I, Roy, as a developer who uses Testim on a daily basis, thought it was horrific. Now, the step params have a cool representation in JSON, exactly like any debugger. This JSON view tree makes it easy to drill down a long object or just have it colorized.
Breakpoint managers
When working with a large and complex test, you might add multiple breakpoints you forgot about. As the test executes, it will pause (maybe several times) when arriving at a breakpoint we no longer need ..
Now, all the breakpoints the user adds will appear in the breakpoint manager:
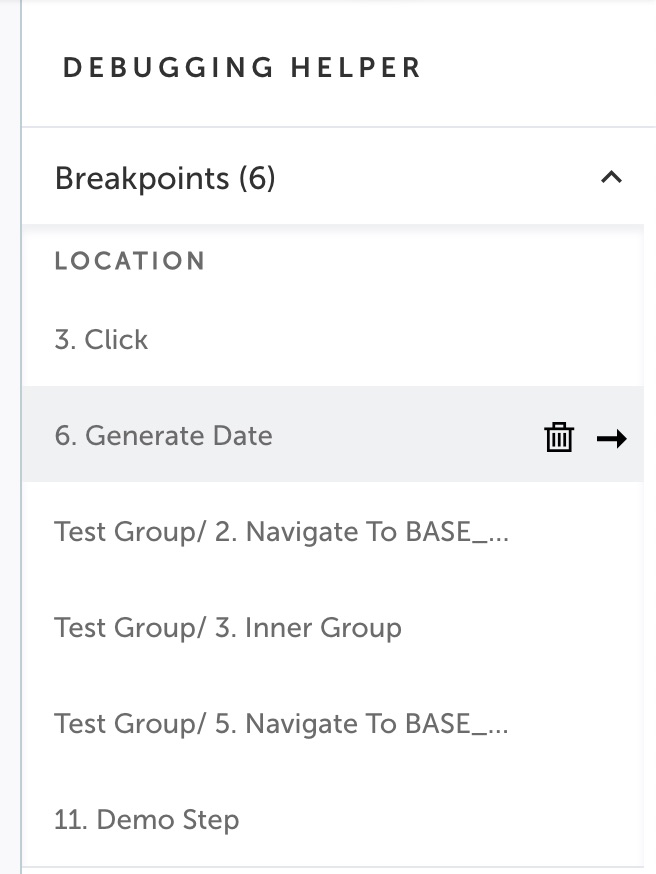
When hovering over an entry in the breakpoint manager, you can do two things—go to the breakpoint or delete it. Simple and elegant.
Wrapping up
I hope you enjoyed this blog post. Our goal—to help people write better tests more easily—is the same today as it was when I joined. We’re taking Testim to where no other E2E platform has ever been.
Need more guidance, want to see the features in action?! Check out this video below👇🏻


